You check a new number on your watch or health app before breakfast. Your pulse looks familiar, your steps make sense, your sleep score is easy enough to follow. Then you see HRV and pause. Maybe the number seems low. Maybe it changed overnight. Maybe your adult child saw it too and asked whether something is wrong.
That reaction is common, especially for older adults and families trying to make sense of more health data than ever. A single number can feel loaded with meaning, even when no one has explained what it measures. The problem is that many guides jump straight to a chart and leave readers alone with it.
A heart rate variability chart by age can be useful, but it doesn't tell the whole story. For many older adults, the better question isn't “How do I compare with everyone else?” It's “What's normal for me, and what changed?”
Table of Contents
- Your First Look at Heart Rate Variability
- What Is Heart Rate Variability
- The Official Heart Rate Variability Chart by Age and Gender
- Why Your Personal Trend Matters More Than the Chart
- Key Factors That Influence Your Daily HRV Score
- How to Track and Act on Your HRV with Rx360
- Turning HRV Data into a Wellness Conversation
Your First Look at Heart Rate Variability
For many people, the first encounter with HRV happens by accident. A retired teacher checks her wearable after a decent night's sleep and sees a number she's never paid attention to. Her daughter searches online, finds a chart, and both of them start wondering if the result means stress, heart trouble, or poor fitness.
That moment matters because HRV sounds technical, but it reflects something very human. It's one way to glimpse how flexibly your body responds to daily demands like sleep, activity, emotional strain, and recovery. It isn't a diagnosis on its own. It's a signal.
One reason HRV causes confusion is that the “normal” range is broad. The average HRV across healthy adults is approximately 42 milliseconds, with a standard range between 19 and 75 milliseconds, and that range tightens significantly in older populations, according to WebMD's overview of heart rate variability.
Practical rule: An HRV number is most helpful when you treat it like a trend, not a verdict.
Older adults often assume every new metric works like blood pressure, where established cutoffs carry clear meaning. HRV doesn't work that way. A number that looks ordinary on a population chart may be low for you. A number that looks low on a chart may be perfectly stable for months and fit your own baseline well.
That's why reassurance and context matter. HRV can help you notice when your body is under extra strain. It can also help families and clinicians spot patterns earlier. But it's only useful when you understand what it is, what age charts can show, and where those charts fall short.
What Is Heart Rate Variability
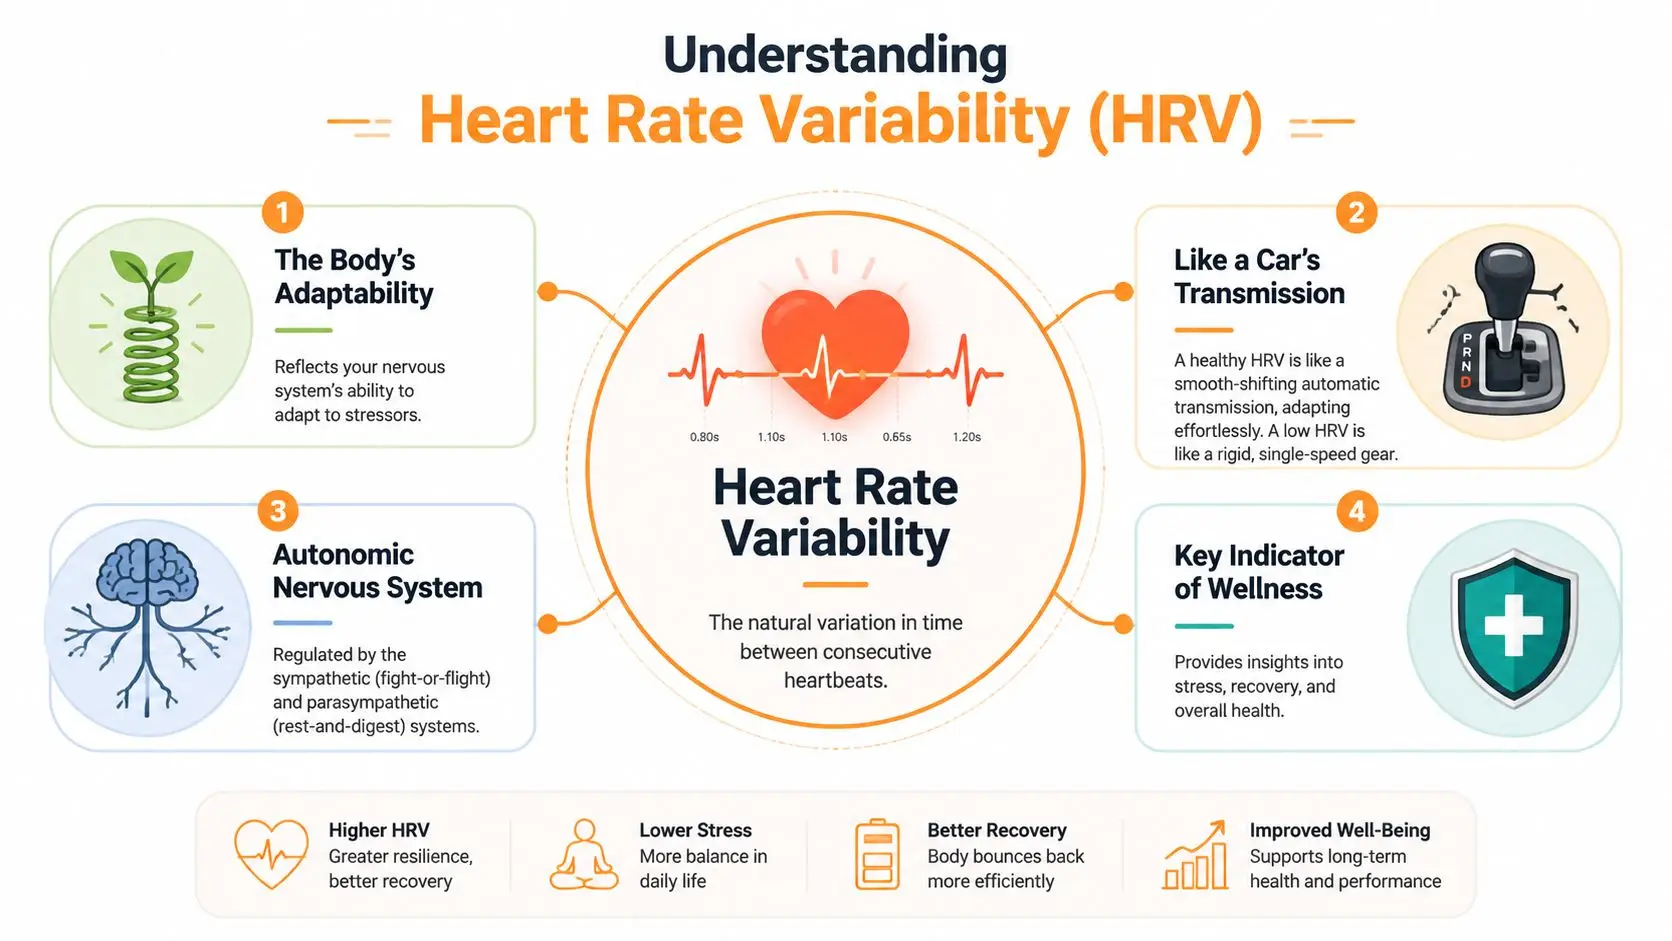
Heart rate variability is the tiny difference in time between one heartbeat and the next. Your heart doesn't beat like a metronome. Even when your pulse seems steady, the spaces between beats naturally shift.
A healthy nervous system usually shows some flexibility in those beat-to-beat changes. That flexibility is part of how your body adjusts to rest, movement, stress, digestion, sleep, and recovery.
What the number actually measures
Think of your body like a car moving through changing road conditions. A well-working transmission shifts smoothly when you need more power, less speed, or a gentler ride. Your autonomic nervous system works in a similar way.
Two branches are involved:
- Sympathetic system: This is the body's “gas pedal.” It helps you respond to challenge, urgency, or threat.
- Parasympathetic system: This acts more like a brake. It supports rest, recovery, and calm regulation.
HRV gives you a window into how those systems are balancing each other. If your system adapts well, your heartbeat pattern tends to show more natural variation. If your system is under strain, that variation may narrow.
Why more variation can be a good sign
Readers often get tripped up on this detail. They hear “variability” and assume it means something unstable or dangerous. In HRV, that's usually not the case. More variability generally points to a nervous system that can respond and recover well.
That doesn't mean “higher is always better,” and it doesn't mean you should chase someone else's number. It means the body has room to adjust. A lower reading can happen when you're tired, stressed, recovering from illness, or operating from a naturally lower baseline.
HRV is less like a test score and more like a daily signal of readiness.
Another point of confusion is measurement. Different devices and apps may calculate HRV in different ways. That's one reason comparisons across platforms can be misleading. If you track HRV, the most useful habit is consistency. Use the same device, under similar conditions, and pay attention to patterns over time.
The Official Heart Rate Variability Chart by Age and Gender
Age-based charts exist for a reason. They show broad population patterns, and one pattern appears again and again. HRV tends to decline as people get older. That decline doesn't mean you're unhealthy. It reflects a normal shift in how the nervous system and heart adapt with age.
In healthy adults, the median HRV measured by RMSSD drops from about 46 to 48 ms in the 18 to 24 age group to about 20 to 23 ms in the 75+ group, based on BodySpec's age-based HRV analysis. The same source notes that falling below the sex-specific 10th percentile, such as under 17 ms for males aged 55 to 64, can be a validated biomarker for excessive physiological stress, poor cardiovascular fitness, or emerging autonomic dysfunction.
How to read the chart
The percentiles are where many readers get lost, so keep it simple:
- 10th percentile: A lower-end value for that age and gender group.
- 50th percentile: The median, or the middle value. Think “typical,” not “ideal.”
- 90th percentile: A higher-end value for that group.
A chart is descriptive. It tells you what a population tends to look like. It does not automatically tell you what your body should be doing on any given Tuesday after a poor night of sleep, a medication change, or a stressful week.
Normative HRV values by age and gender
The table below uses verified normative values described in the available data. Only the values explicitly provided are included.
| Age Range | Gender | 10th Percentile Low | 50th Percentile Median | 90th Percentile High |
|---|---|---|---|---|
| 18–24 | Male | Not provided | 46 ms | Not provided |
| 18–24 | Female | Not provided | 48 ms | Not provided |
| 25–34 | Male | 24 ms | 41 ms | Not provided |
| 25–34 | Female | 23 ms | 43 ms | Not provided |
| 55–64 | Male | <17 ms | Not provided | >50 ms |
| 60s | Female | Not provided | 24 ms | Not provided |
| 65–74 | Male | 15 ms | Not provided | 44 ms |
| 75+ | Male | Not provided | 20 ms | Not provided |
| 75+ | Female | Not provided | 20 ms | Not provided |
A few details help make this chart more useful:
- Age matters: Median HRV values move downward across adulthood.
- Sex-specific rows matter: Normal ranges differ by gender in the available reference sets.
- The median is not a target: Being below the 50th percentile doesn't automatically mean poor health.
- Extremes deserve context: A low reading may reflect stress, illness, poor sleep, medication effects, or a chronic condition.
If you're using a heart rate variability chart by age, use it as orientation, not judgment. It can help you place your number in a wider context. It can't replace a personal baseline.
Why Your Personal Trend Matters More Than the Chart
Charts can calm people down, but they can also create unnecessary worry. An older adult sees a reading that looks low compared with a general chart and assumes something is wrong. Sometimes that's the wrong conclusion.
HRV is highly individual. One example from Banner Peak Health's discussion of HRV charts by age makes this clear. A 62-year-old may have an HRV of 20 to 25 ms, which looks low by chart standards but may be normal for that person over time. That same source warns that relying too heavily on age-based charts can lead to anxiety and misinterpretation, and emphasizes tracking personal trends instead of fixed benchmarks.
A chart shows the crowd, not your baseline
Population charts answer one question well. They show what tends to happen across large groups as people age.
They don't answer the question most individuals care about. They don't tell you whether today's reading is normal for your body, your health history, your medications, your sleep pattern, or your stress load.
A stable pattern is often more reassuring than a single “good” number.
This is especially important in later life. Two people of the same age can have very different baseline HRV readings and still both be functioning well. Genetics, lifelong fitness habits, health conditions, and medication use all shape the number you see.
What to watch instead
A more useful approach is to look for changes in your own pattern. Ask questions like these:
- Is the number steady? If your HRV usually stays in a similar range, that consistency may matter more than chart placement.
- Did it dip for a reason? Poor sleep, travel, emotional strain, alcohol, or a minor illness can all affect a short-term reading.
- Is it staying lower than usual? A persistent change is often more worth noticing than a one-day drop.
- How do you feel? HRV is strongest when matched with symptoms, energy, and recovery.
Families often find this shift helpful. Instead of reacting to one low reading, they can watch for a pattern: lower HRV, more fatigue, less activity, worse sleep, or slower recovery after exertion. That combination is usually more informative than the chart alone.
If you remember one thing from any heart rate variability chart by age, let it be this. Your own trend tells the more personal story.
Key Factors That Influence Your Daily HRV Score
Daily HRV changes for many reasons. Some are tied to routine habits. Some reflect emotional load. Others come from medical realities that become more common with age.
That's why a one-size-fits-all interpretation often fails older adults. The number on your screen may reflect much more than age alone.
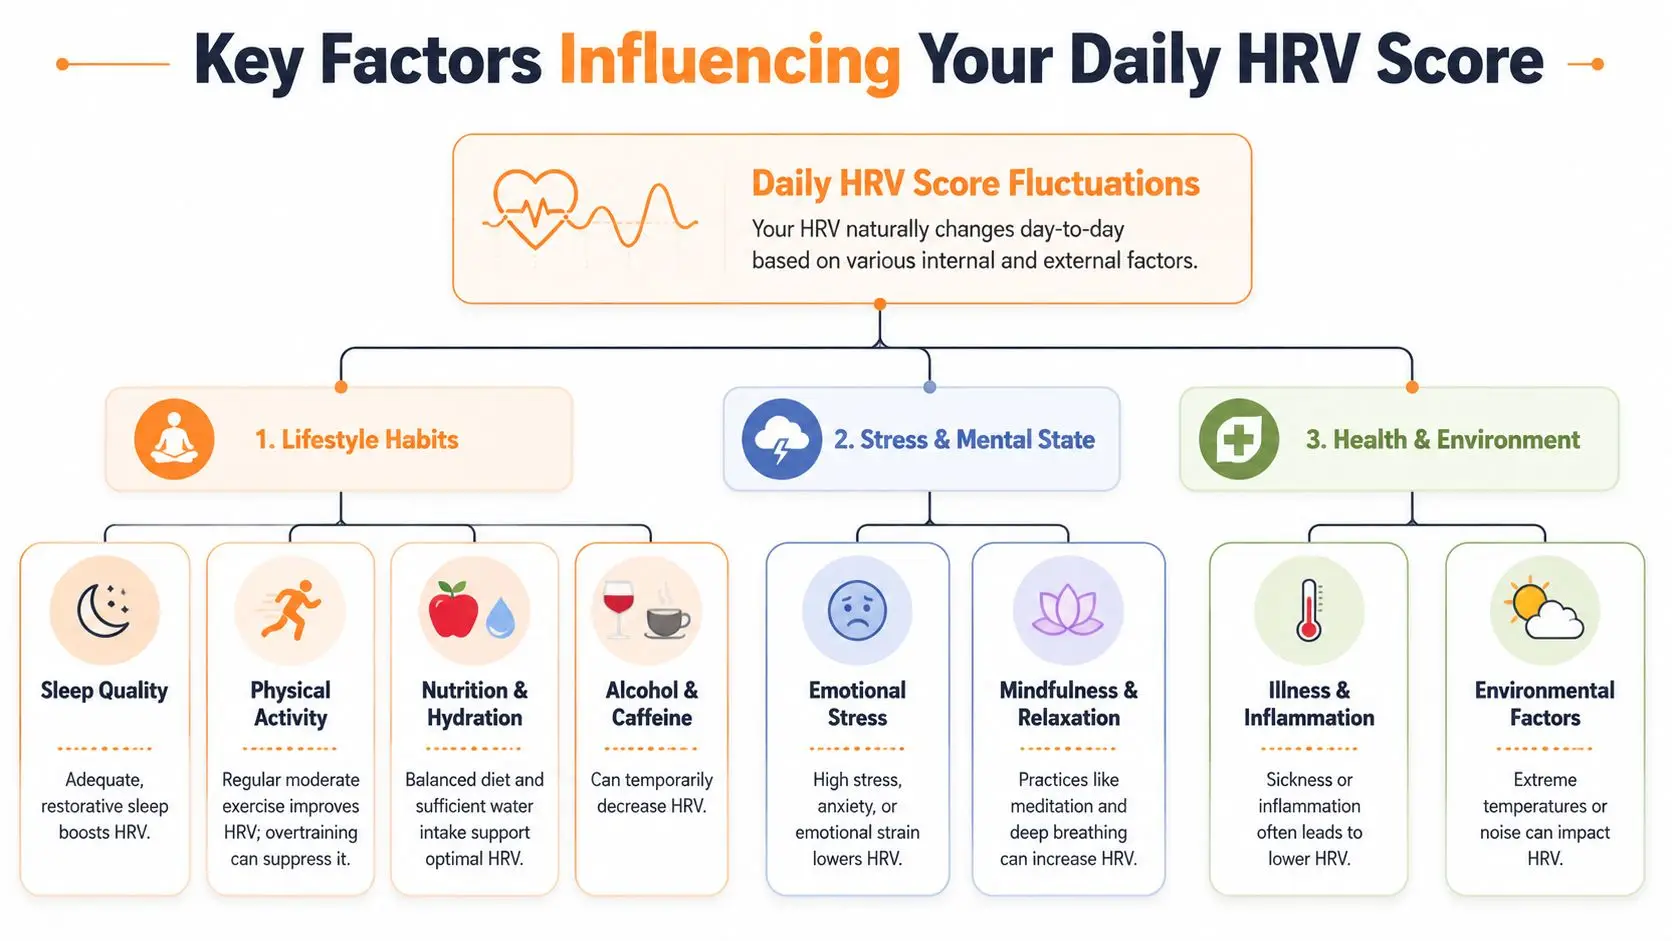
Lifestyle habits
The first group of influences is everyday behavior. These tend to show up quickly in HRV patterns.
- Sleep quality: Restorative sleep often supports a healthier HRV pattern. Broken or short sleep can pull it down.
- Physical activity: Regular movement can help over time, while very hard exertion may temporarily suppress recovery signals.
- Hydration and food intake: Your body often responds better when basic needs are met consistently.
- Alcohol and caffeine: These can shift daily readings, especially when they disrupt sleep or increase strain.
Some people notice a pattern within a week of tracking. They sleep poorly, their HRV dips. They rest and rehydrate, and the reading settles back toward its usual range.
Stress and mental state
Emotional strain affects the body even when nothing dramatic is happening. Worry, caregiving pressure, grief, loneliness, and ongoing tension can all show up in HRV.
A lower reading on a stressful day doesn't mean you failed at wellness. It may only mean your body is working hard to manage the load. That can be useful information.
Worth remembering: HRV often reflects life stress before people put it into words.
Relaxation practices can matter here, too. Gentle breathing, quiet routines, time outdoors, prayer, meditation, or reducing stimulation may support better recovery. The exact method matters less than the consistency.
Health conditions and medications
This is the area many general guides skip, and it's one of the most important for older adults.
According to the verified data from PubMed Central on HRV in medically complex populations, beta-blockers, diabetes, and sedentary lifestyles can lower HRV by 30% to 50% independent of age, and adults over 65 with Type 2 diabetes often have HRV values below 20 ms even when healthy by age charts.
That changes the conversation. A lower HRV in an older adult may not solely be “because of aging.” It may also reflect:
- Medication effects: Some heart and blood pressure medicines can influence autonomic function.
- Chronic disease burden: Diabetes and other long-term conditions can shape HRV in ways age charts don't capture.
- Deconditioning: Lower activity levels can affect resilience and recovery.
This is why context matters so much. If your number is lower than expected, the question isn't just “Is this bad?” A better question is “What factors in my life or treatment plan could be influencing it?”
How to Track and Act on Your HRV with Rx360
Good HRV tracking doesn't require obsessing over a number. It requires a repeatable routine and a place to notice patterns clearly.
For most older adults and families, the most helpful approach is simple. Use the same device, check under similar conditions, and look for changes that line up with how the person feels and functions. A connected platform can make that easier by keeping the information visible and shareable instead of scattered across apps or forgotten after a quick morning glance.

A simple way to track patterns
A practical routine often looks like this:
- Measure consistently: Morning readings are often easiest to compare because the conditions are more similar day to day.
- Watch the pattern, not one reading: Look for several days of change, not a single unexpected number.
- Add real-life notes: Sleep, illness, stress, exercise, travel, and medication changes help explain the data.
- Share when needed: Families and clinicians can make better sense of HRV when they can see the trend alongside daily wellness information.
That's where a connected tool like Rx360's wellness platform becomes useful. It can support a clearer view of patterns over time, help loved ones stay informed, and make it easier to bring meaningful observations into routine care rather than waiting for a problem to become obvious.
When to bring HRV into a care conversation
HRV becomes more actionable when paired with other changes. Bring it up if a lower-than-usual trend shows up with fatigue, lightheadedness, poor sleep, slower recovery, reduced appetite, or a change in daily function.
You don't need to walk into an appointment asking for a perfect HRV number. A more helpful conversation sounds like this: “This reading has stayed below the usual pattern for several days, and I've also noticed less energy and worse sleep.”
That gives a clinician something real to work with. It turns HRV from an abstract metric into a useful part of the health story.
Turning HRV Data into a Wellness Conversation
The most helpful way to think about HRV is not as a score to win. It's a form of feedback. Your body is telling you how much flexibility and recovery capacity it has at that moment.
A heart rate variability chart by age can offer perspective, especially if you're seeing the number for the first time. But older adults and families often get the most value from a different mindset. Watch the baseline. Notice changes. Add context. Then talk about those changes with the people involved in care.
That approach is calmer and more useful. It respects the fact that aging, medications, chronic conditions, stress, and lifestyle all shape HRV. It also helps avoid the common trap of treating one number like a final answer.
When HRV is used well, it can support better questions. Why am I more run down this week? Am I recovering from that illness? Has this medication change affected how I feel? Those are the kinds of questions that lead to better conversations and more confident decisions.
Rx360 helps older adults, families, and care teams turn everyday wellness signals into clearer, more connected support. If you want a simpler way to stay informed, stay connected, and support independent living, explore Rx360.
Lower-Risk Medication Plan Checklist
Below is a practical checklist and step plan you can implement into your daily life:
-
List all medications
Include prescriptions, over-the-counter drugs, supplements, sleep aids, creams, patches, eye drops, and inhalers.
-
Mark fall-risk drugs
Flag medicines that cause dizziness, sleepiness, confusion, blurred vision, low blood pressure, or low blood sugar.
-
Ask for a medication review
Bring the list to a pharmacist or prescriber.
-
Review after any warning sign
Request a new medication check after a fall, near-fall, new prescription, dose change, dizziness, or confusion.